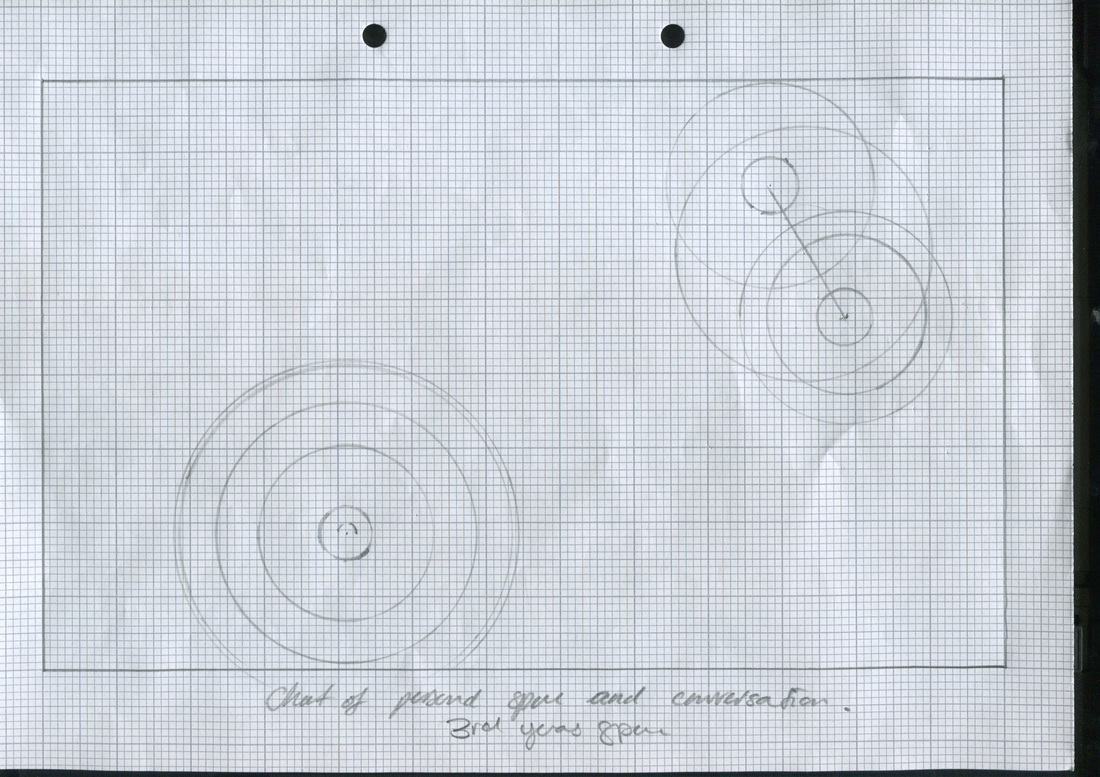
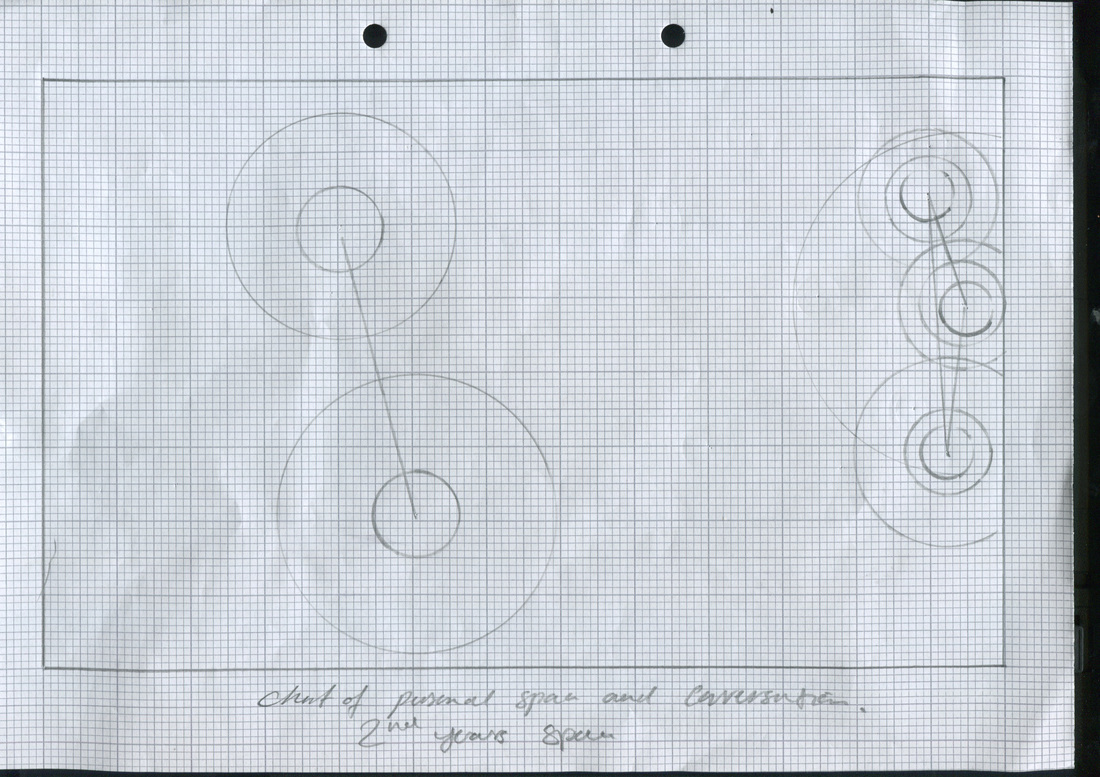
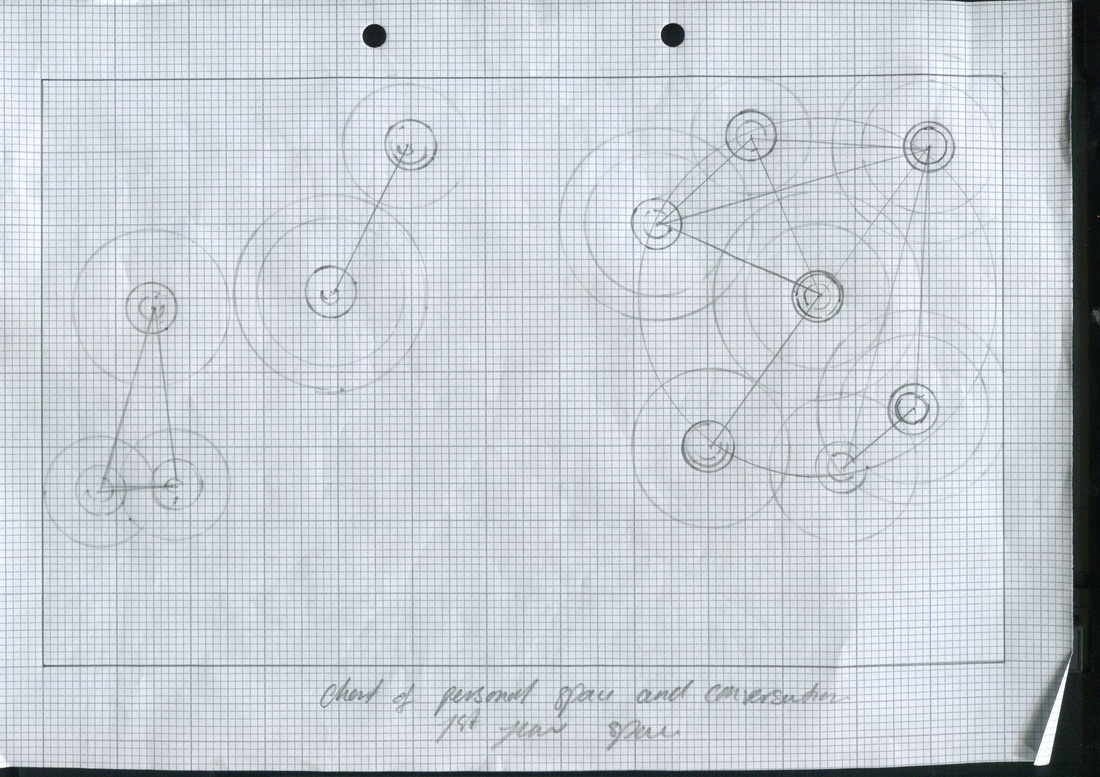
These graphs are my favourite at the moment. They are based on population and living graphs. I have arranged them like this because they are each section of the studio, with the first being the Third years space, the second being the Second years space the last being the First years space. There is a correlation that the higher the year the less people are in.
 RSS Feed