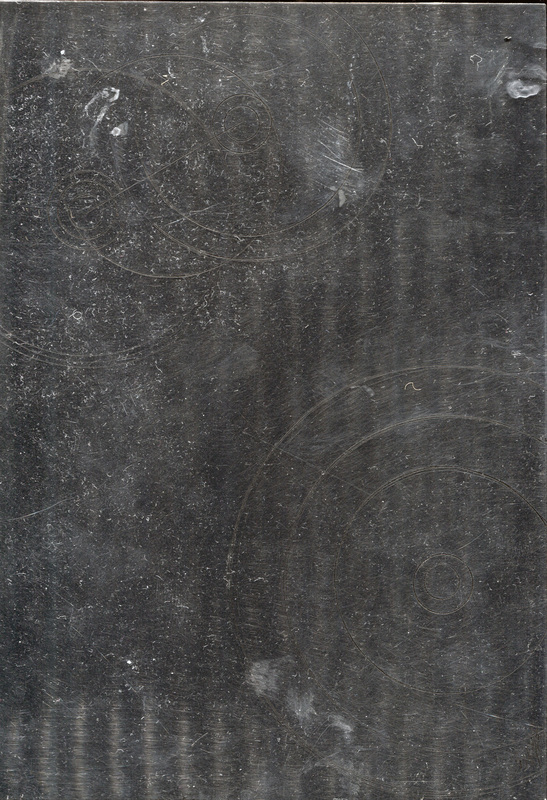
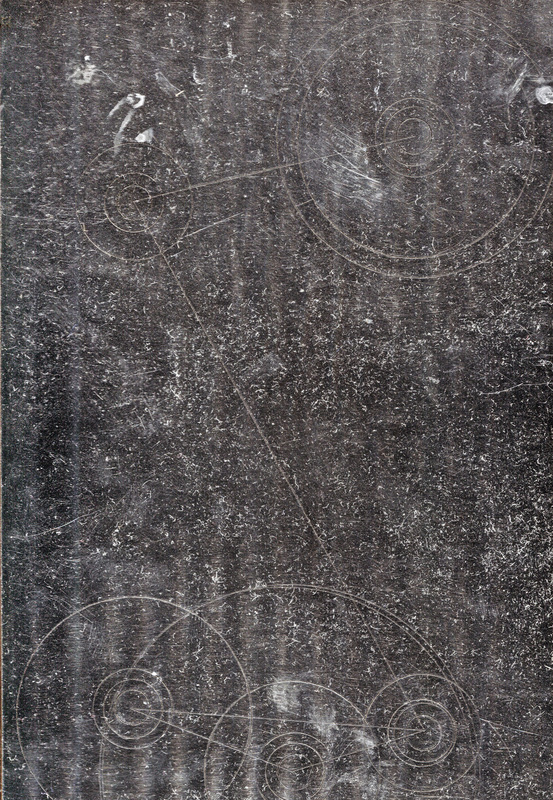
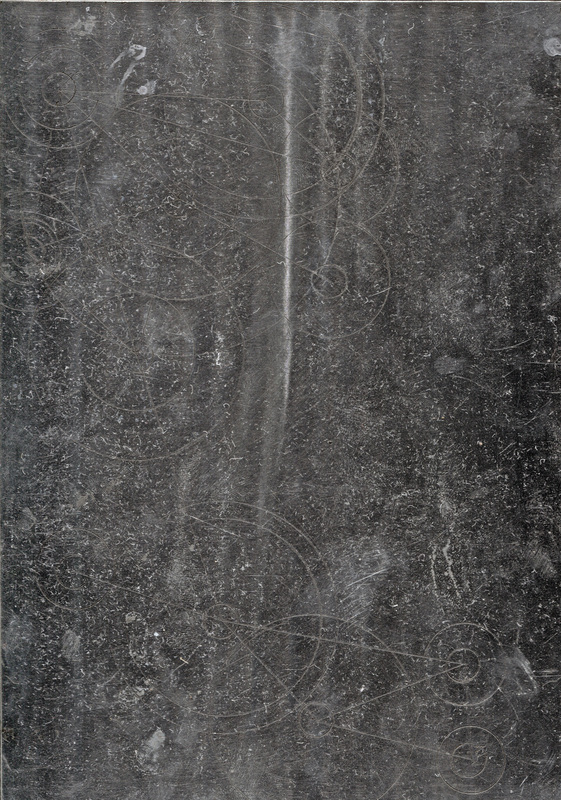
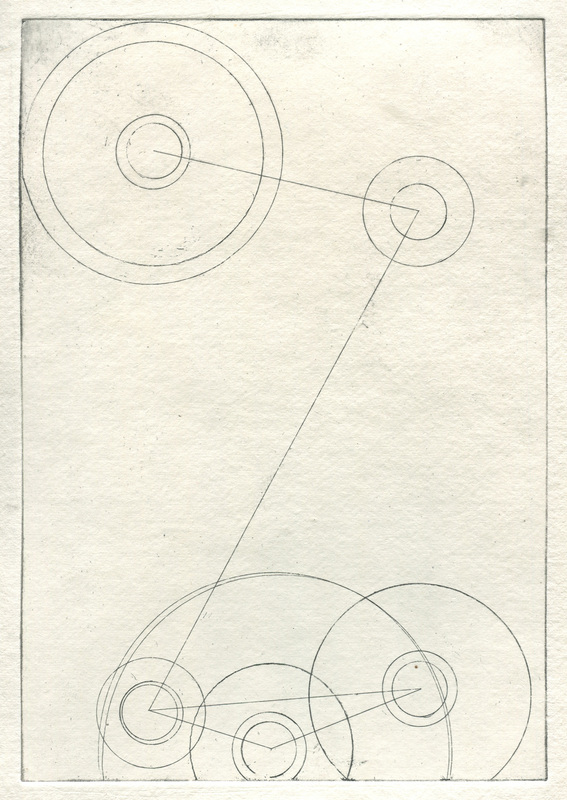
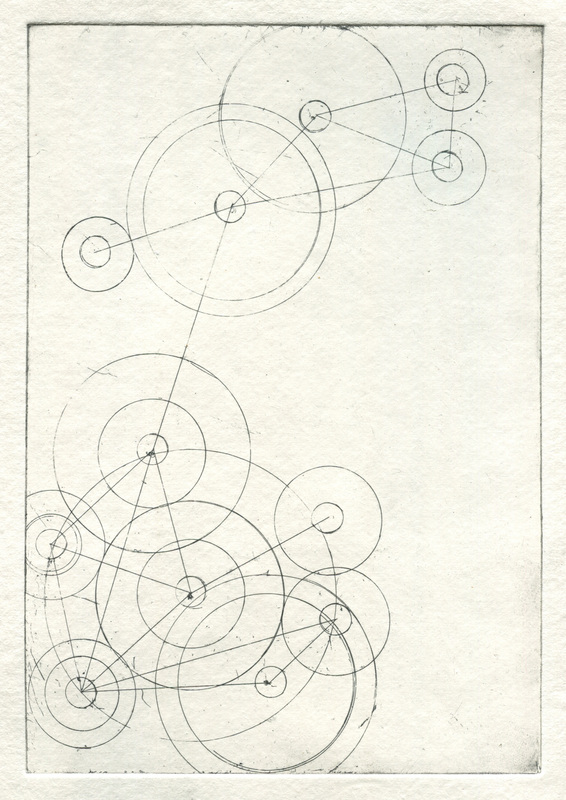
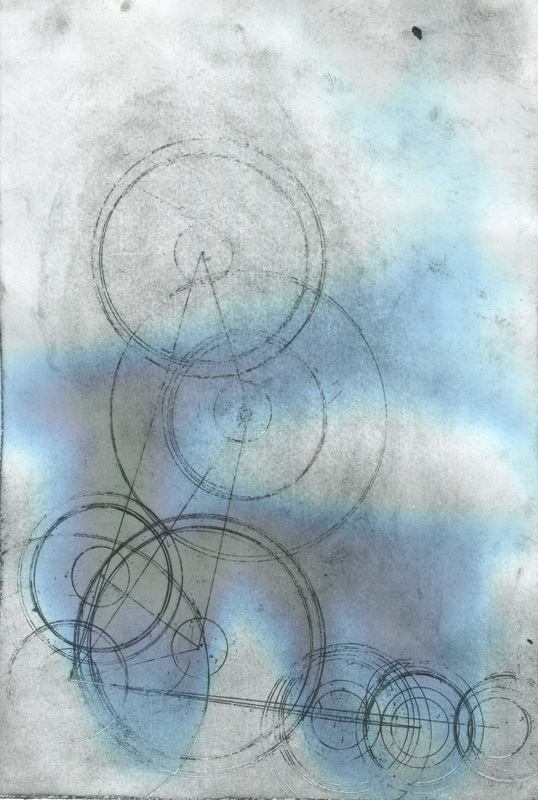
Ironically I think I prefer the plates of the etchings rather than the actual prints. They have better quality in them, perhaps as they show more of how the work was made? Perhaps more of the essence of the work than the prints..
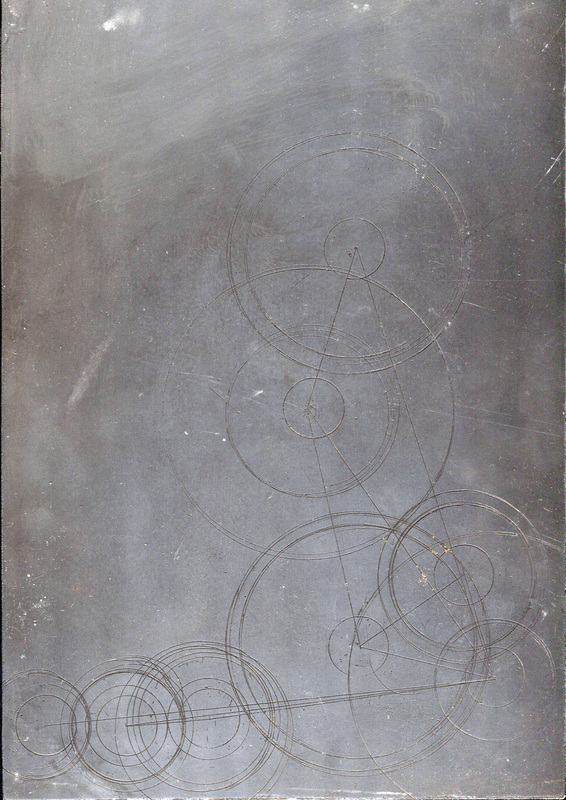
The zinc plate hasn't scanned in as well as the steel ones did because of it's mirror like surface, although I feel like this adds something to plate, showing how different the zinc and Steel plates are.
The zinc plate hasn't scanned in as well as the steel ones did because of it's mirror like surface, although I feel like this adds something to plate, showing how different the zinc and Steel plates are.


 RSS Feed