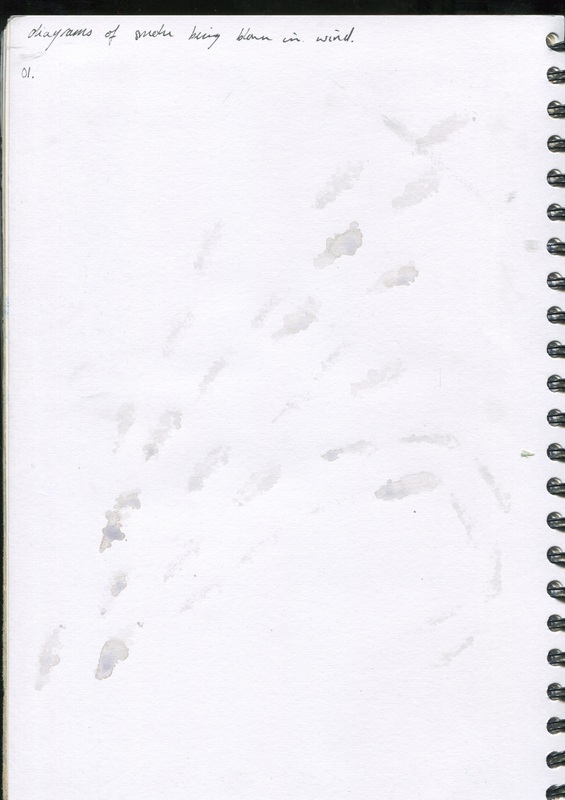
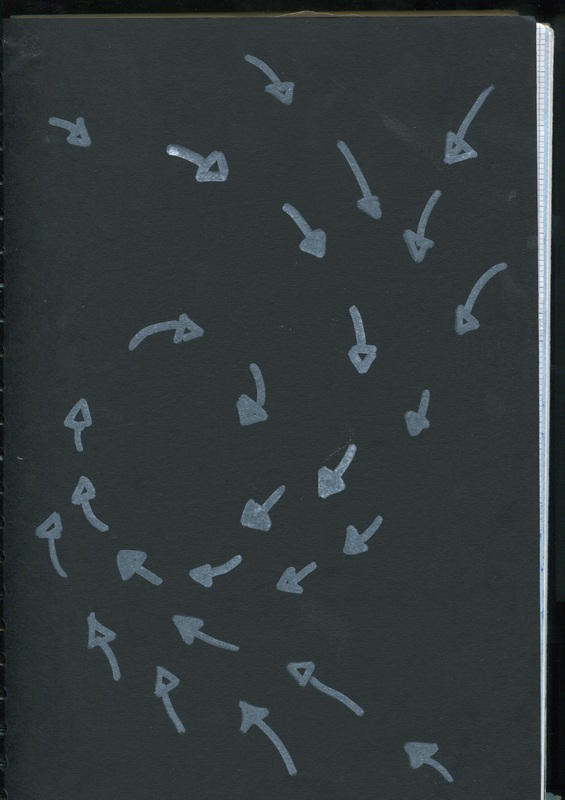
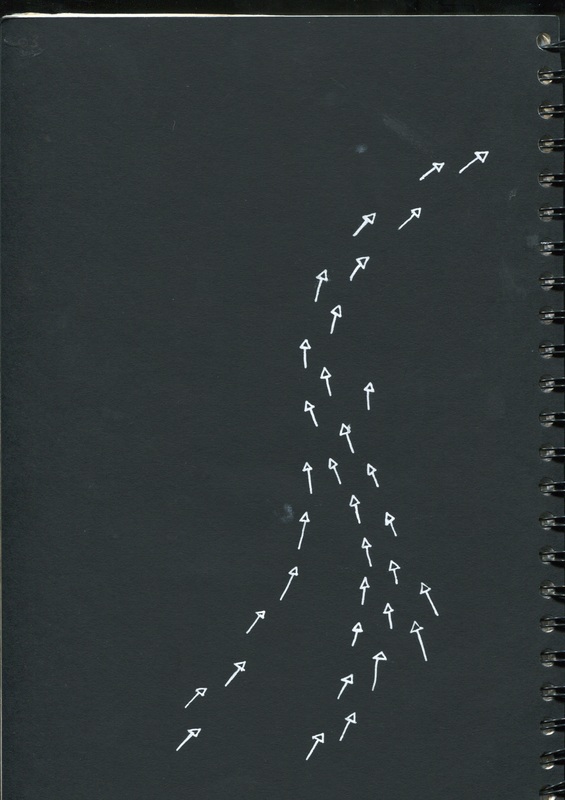
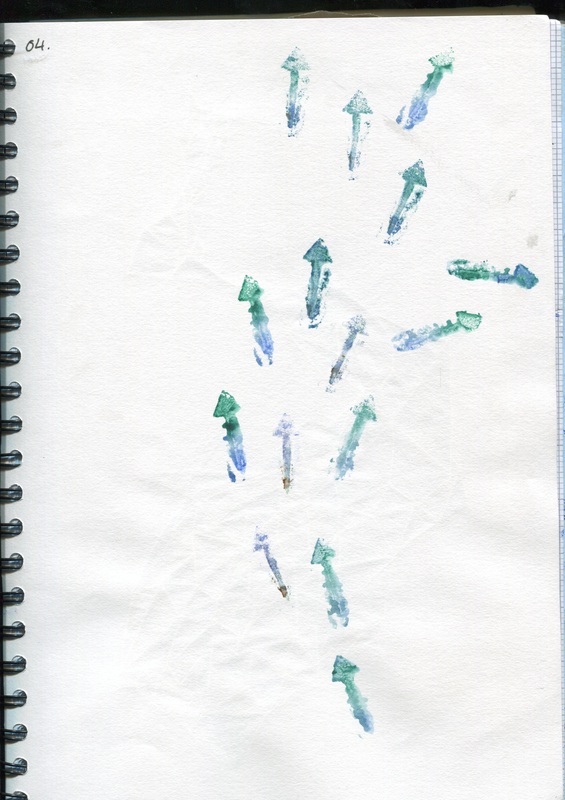
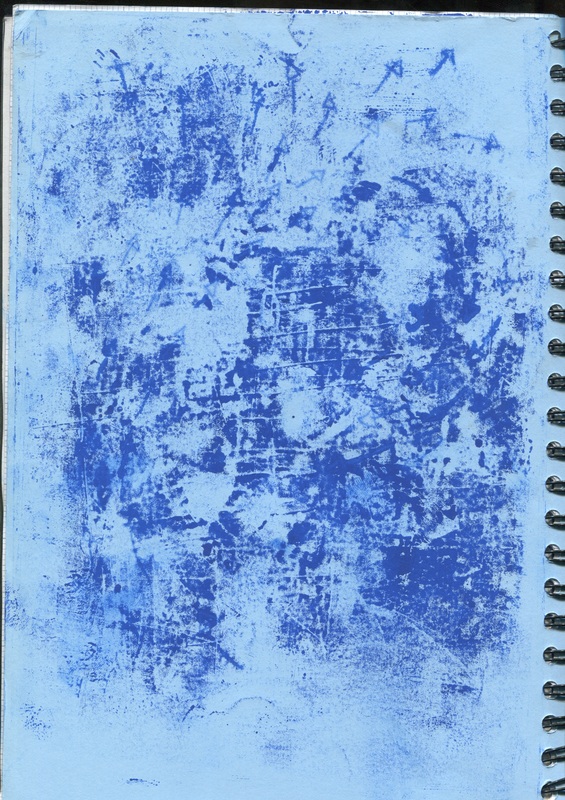
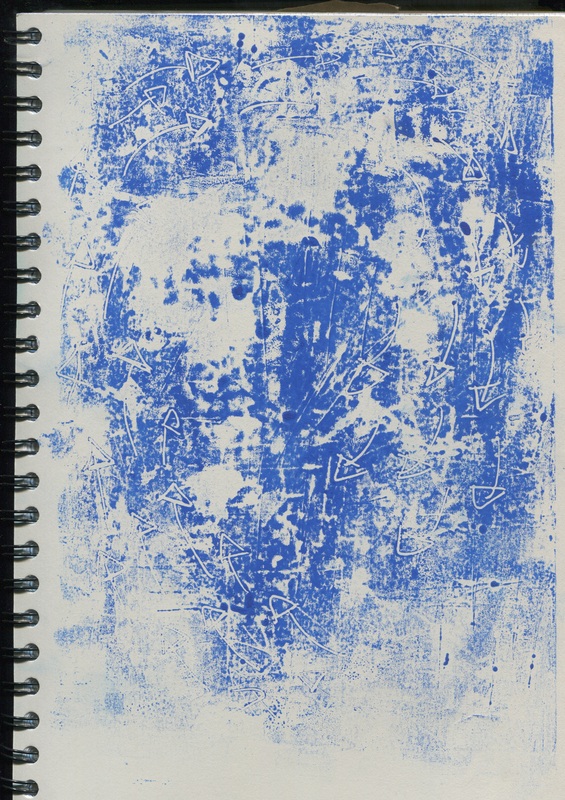
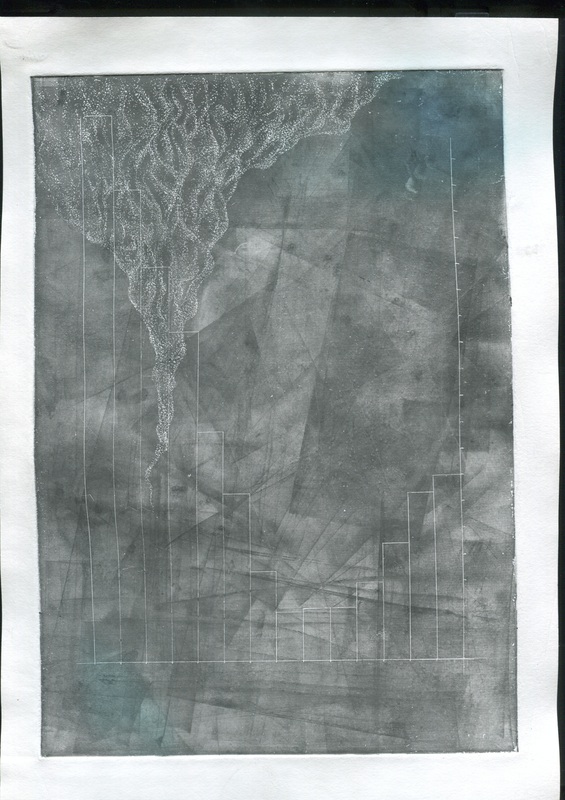
Looking at the wind blowing the smoke I began to start taking photos of the smoke then I drew and printed arrows showing the directions of the wind blowing the smoke. I particularly like the first one as it is almost smokey itself and I like the last two as you have to look to find the arrows in the print.
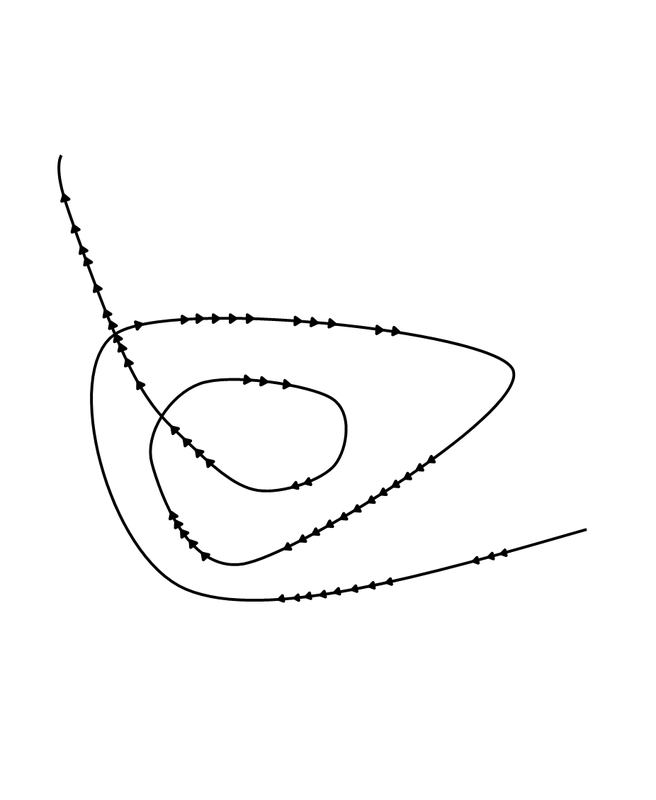
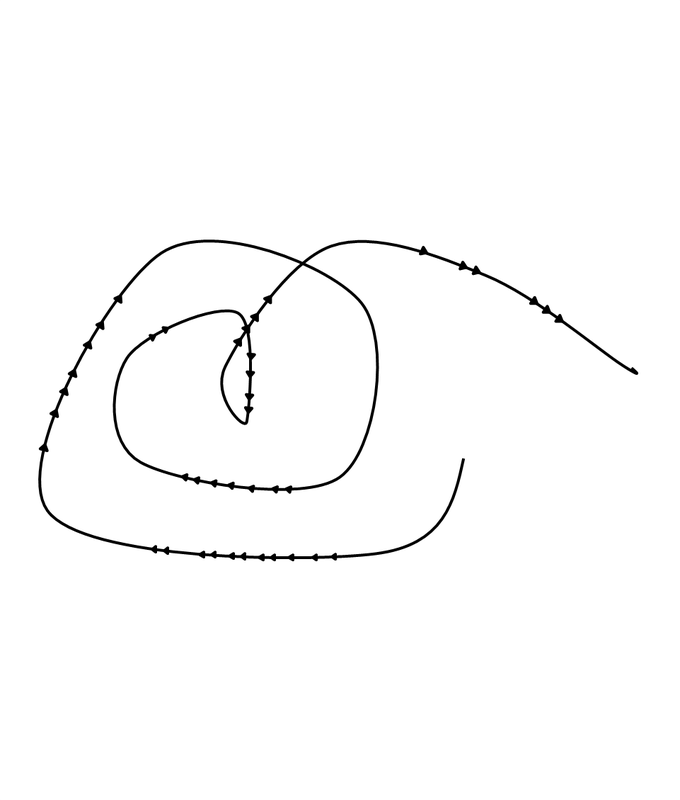
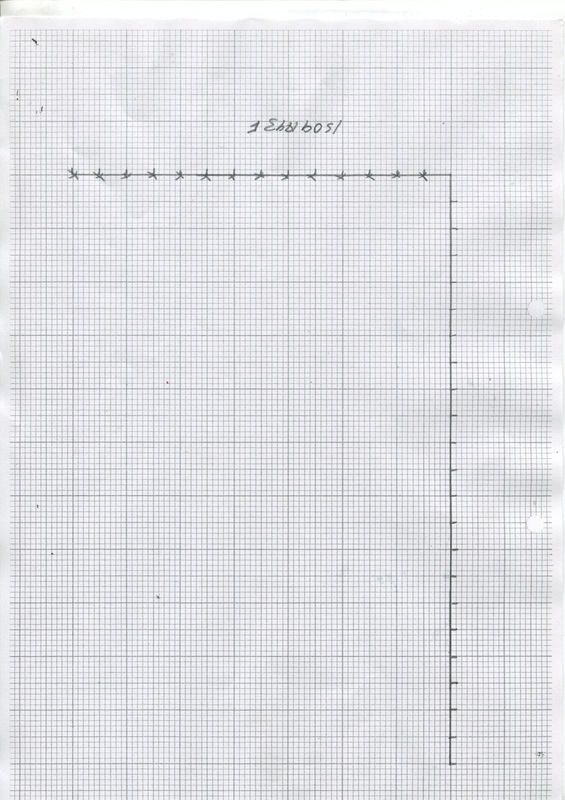
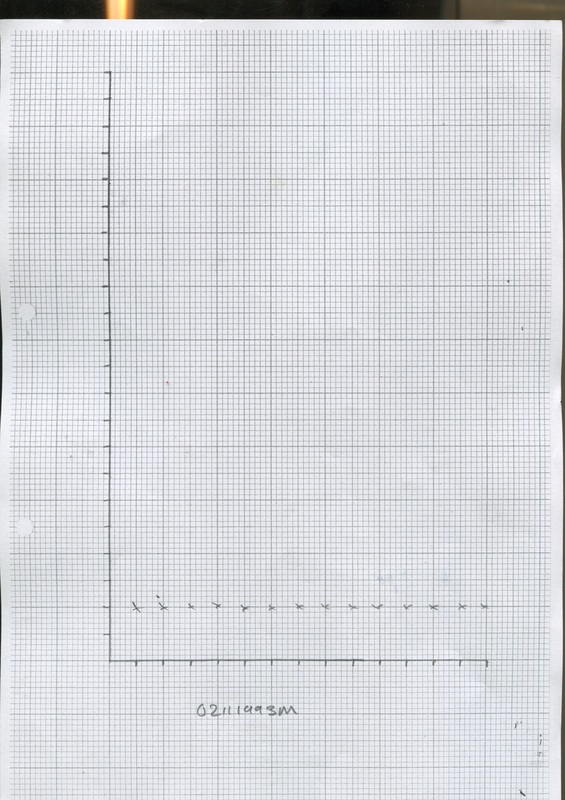
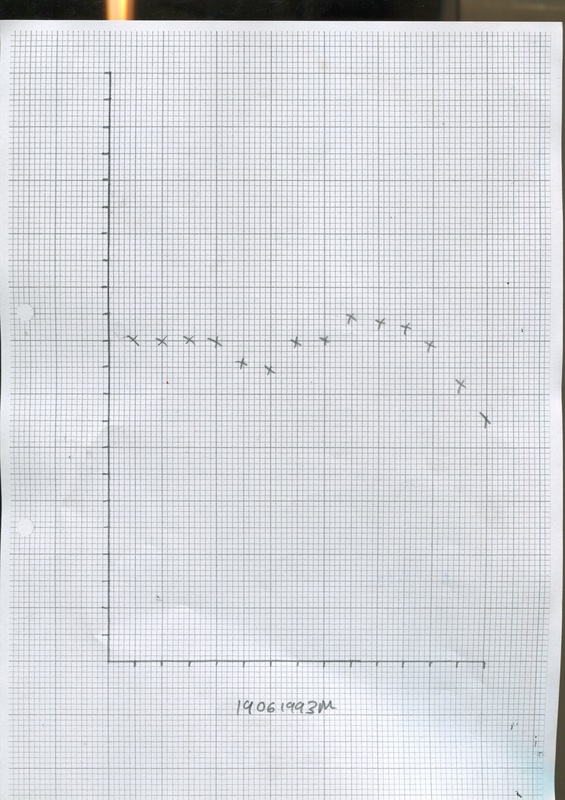
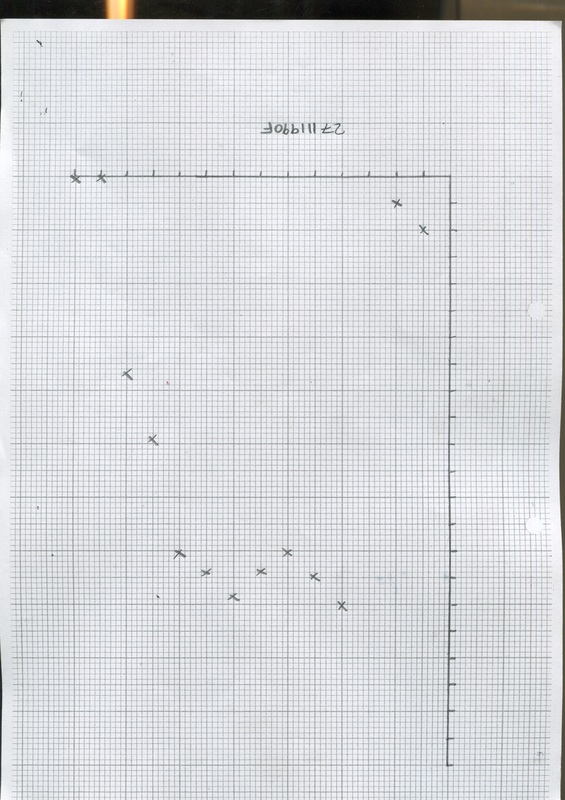
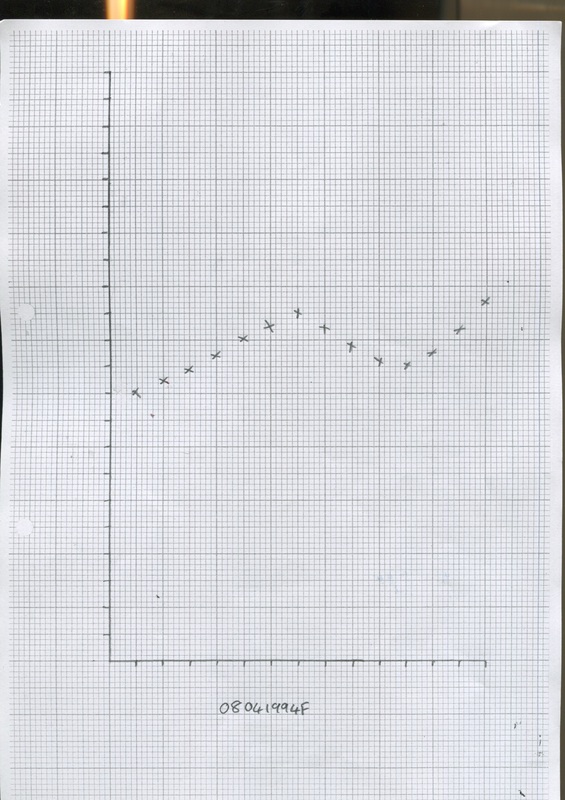
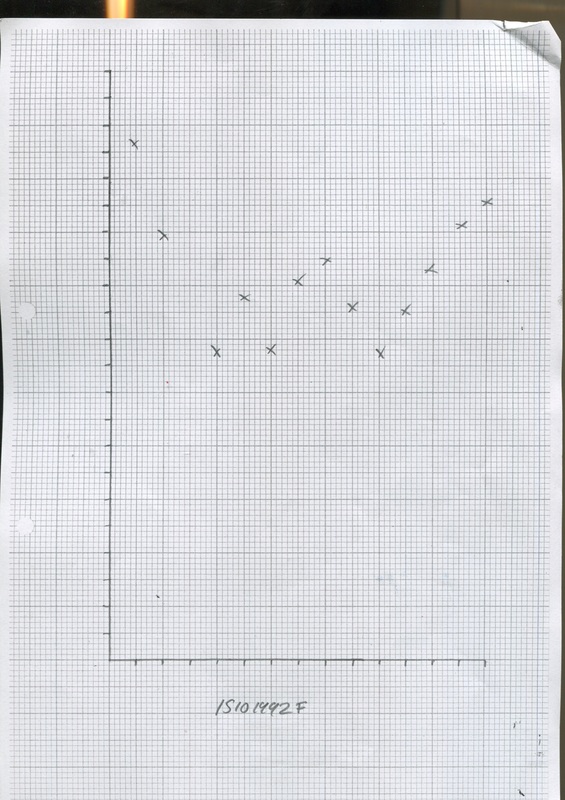
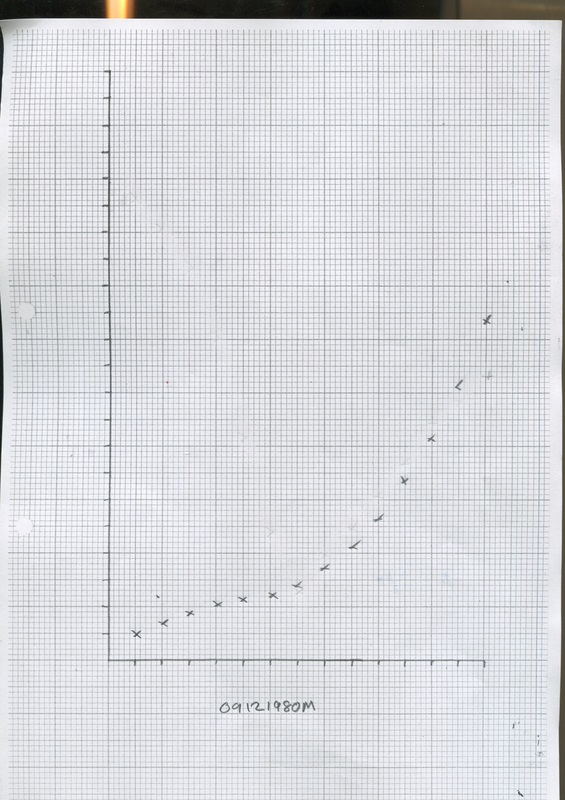
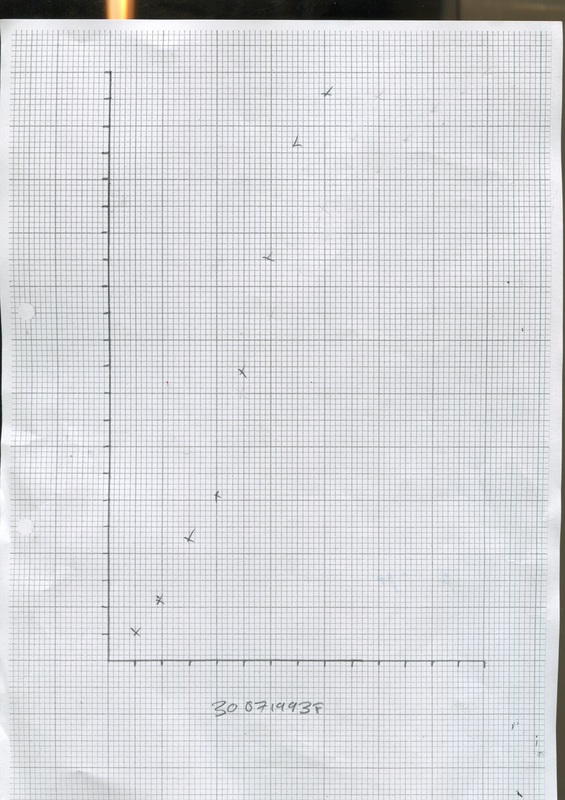
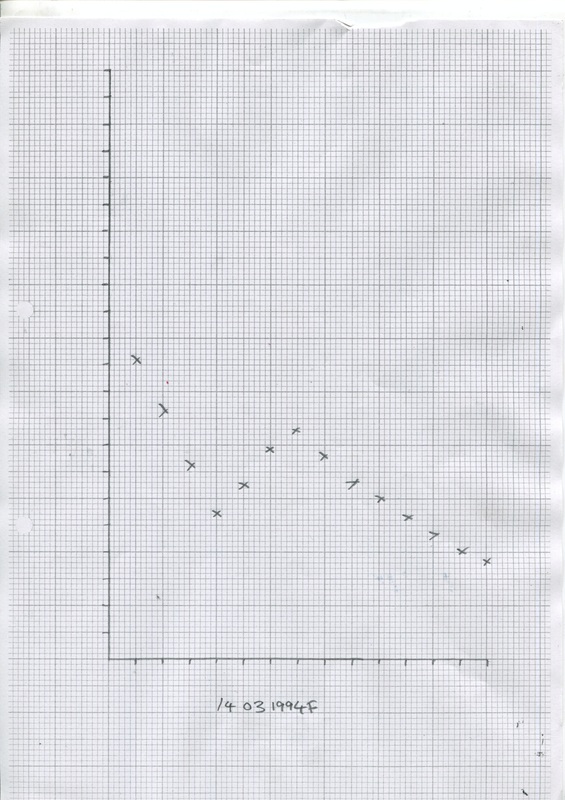
Out of boredom I've been blowing up balloon and letting them go to see how they deflate, none of them ever deflating in the same way. I have recorded them on my phone and drawn a line following the balloon. These are based weather forecast wind graphs. 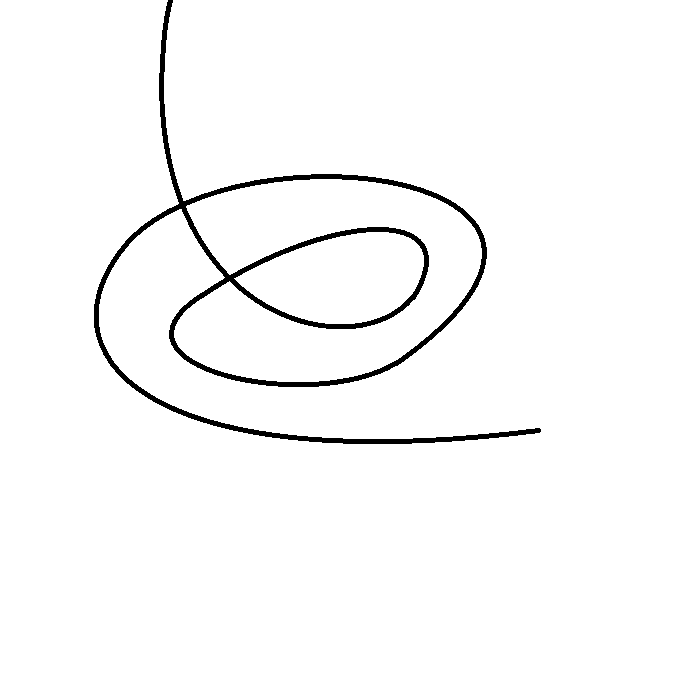
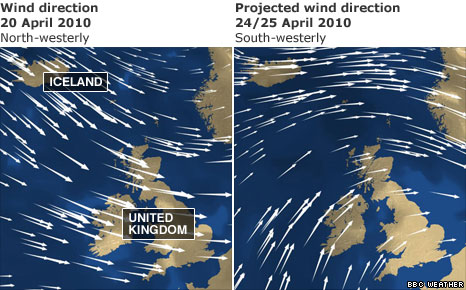
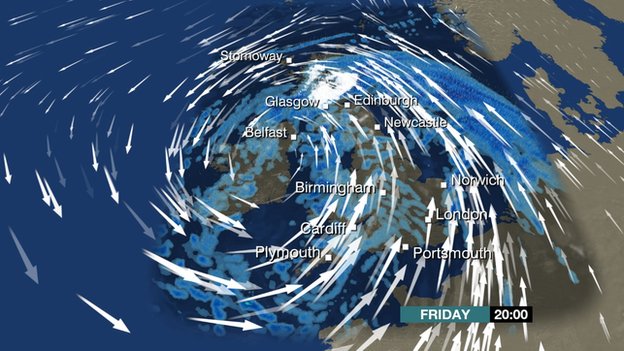
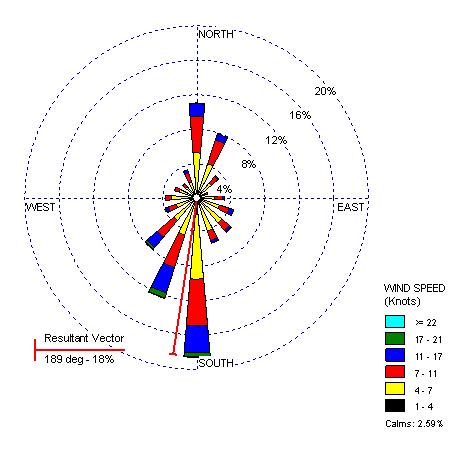
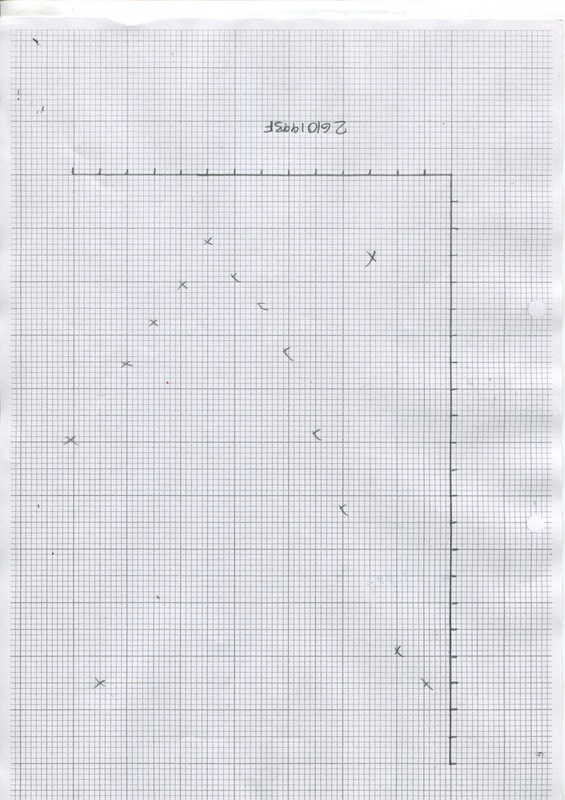
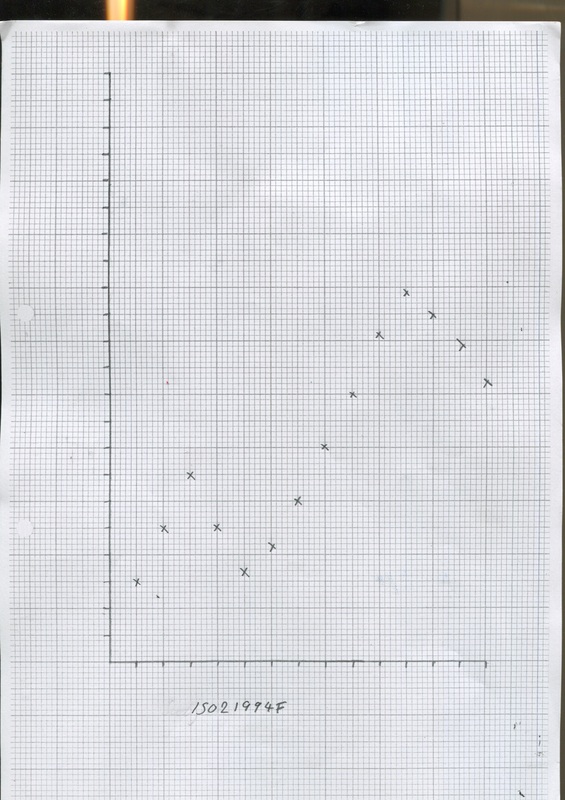
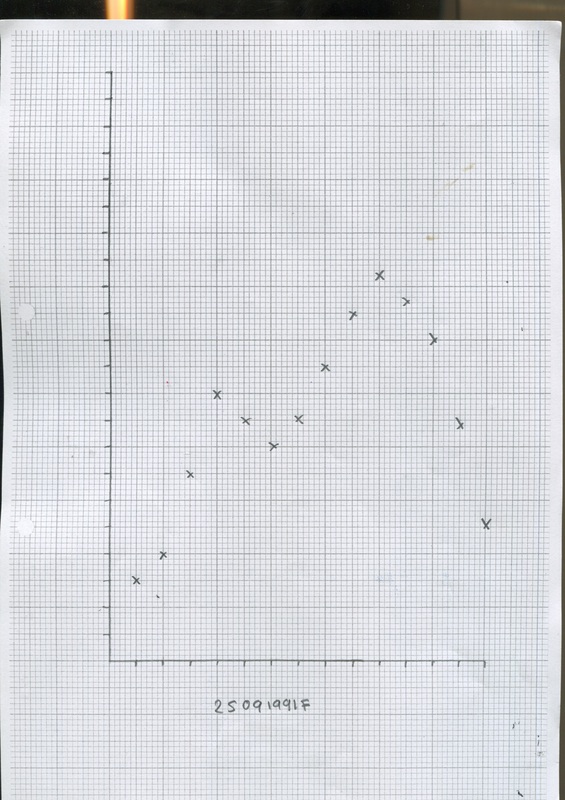
I've been watching the weather forecast a lot recently and I've been fascinated with the wind forecast, I thought that this would be an interesting thing to try and measure and make illustrations of the measurements. 'Function World' is a comic strip by Grant Snider. I love this comic as it is so similar to my work, he's looking at everyday things in a different way. Which is what I am trying to do in my project, he is a great inspiration. 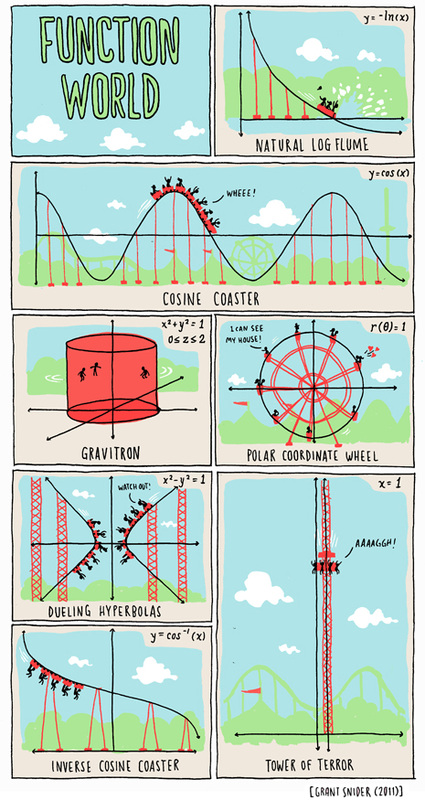
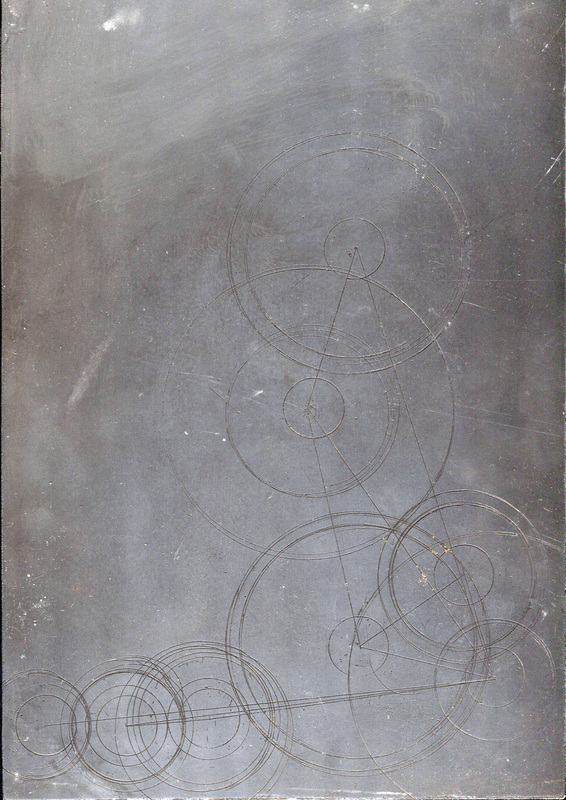
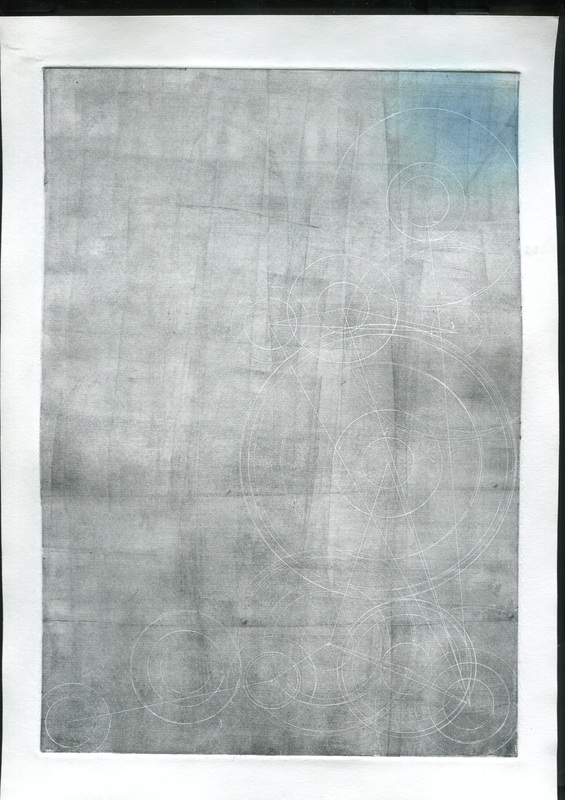
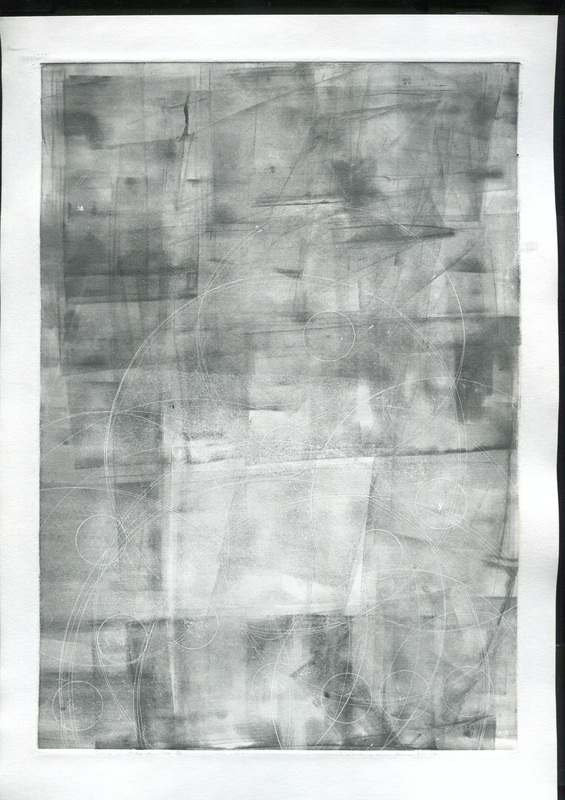
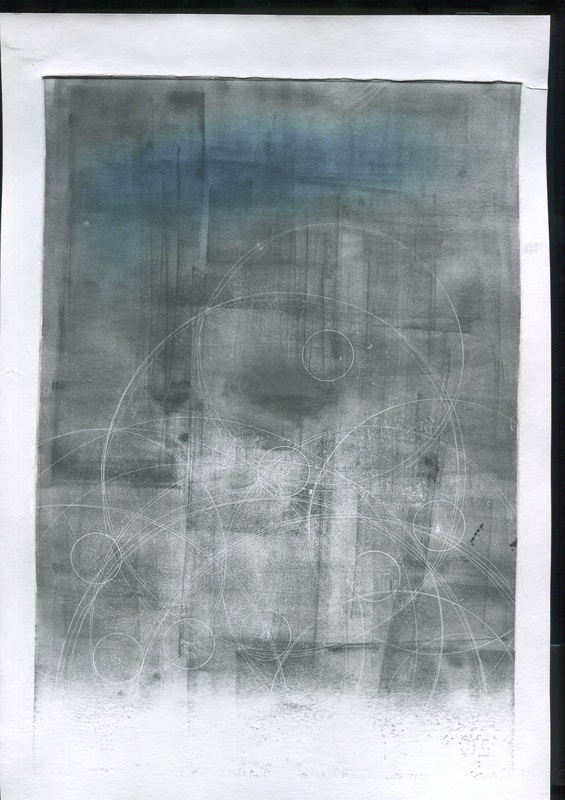
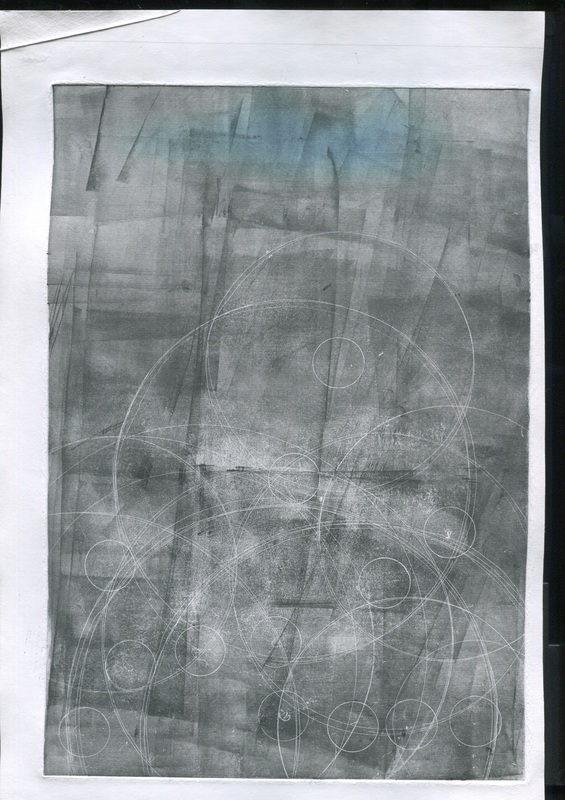
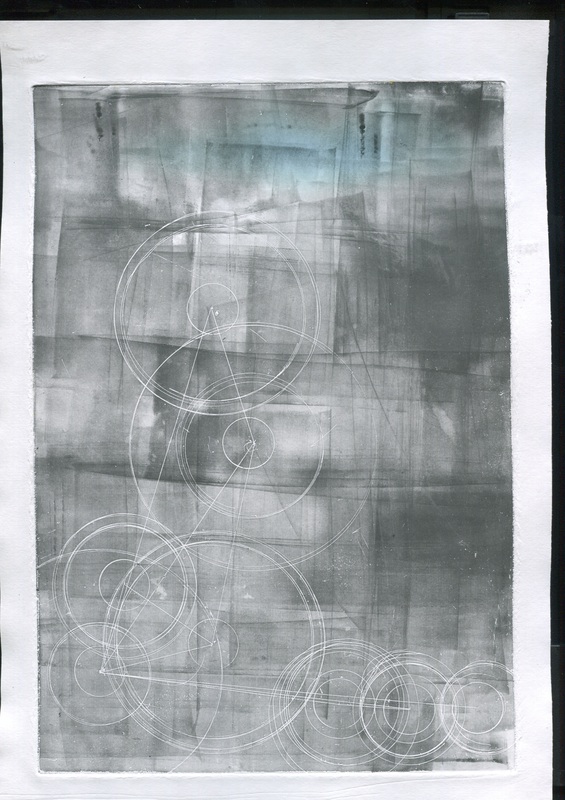
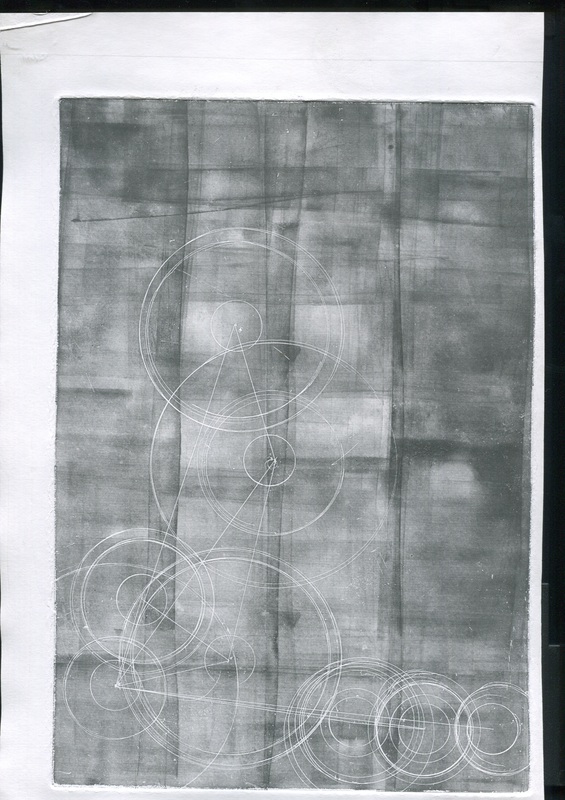
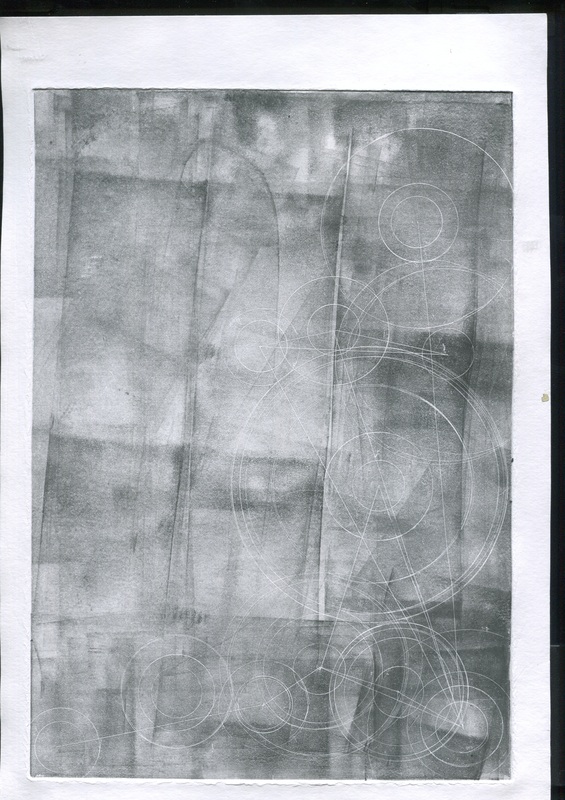
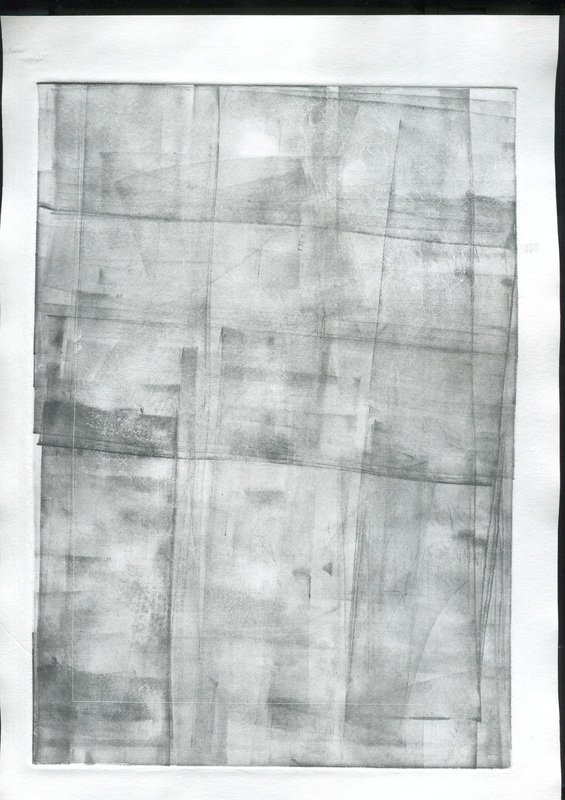
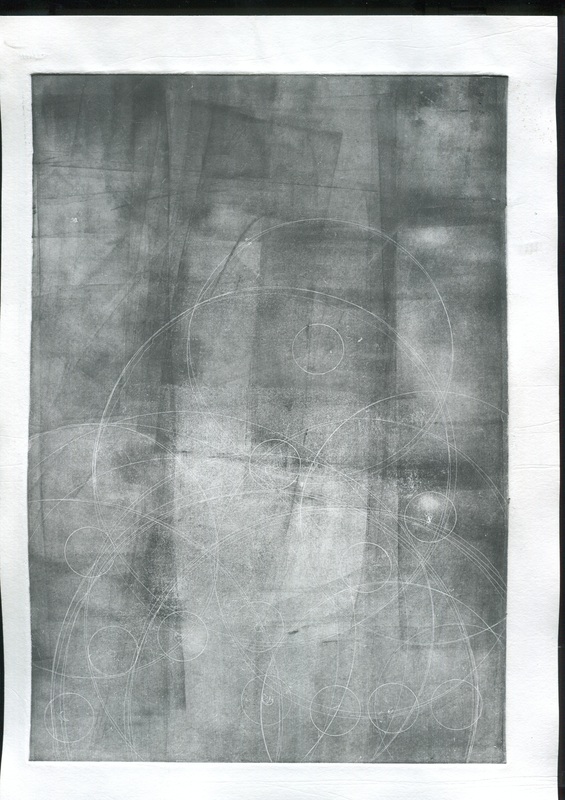
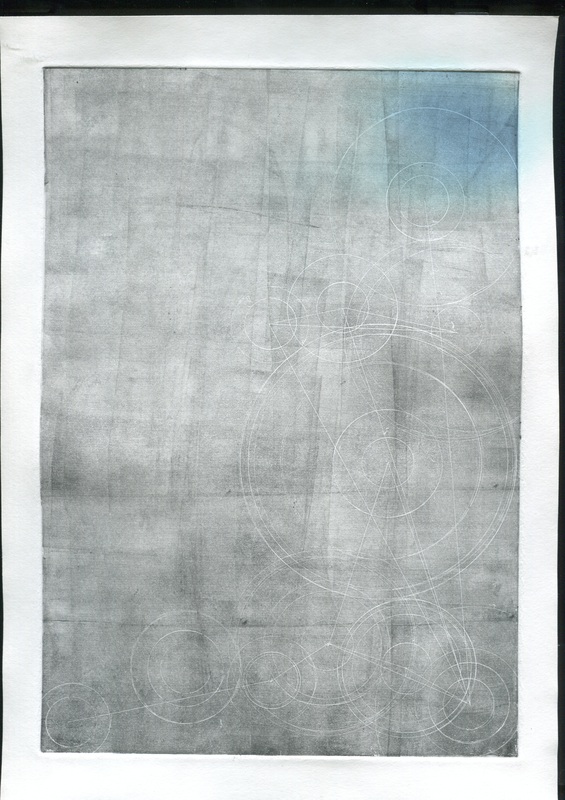
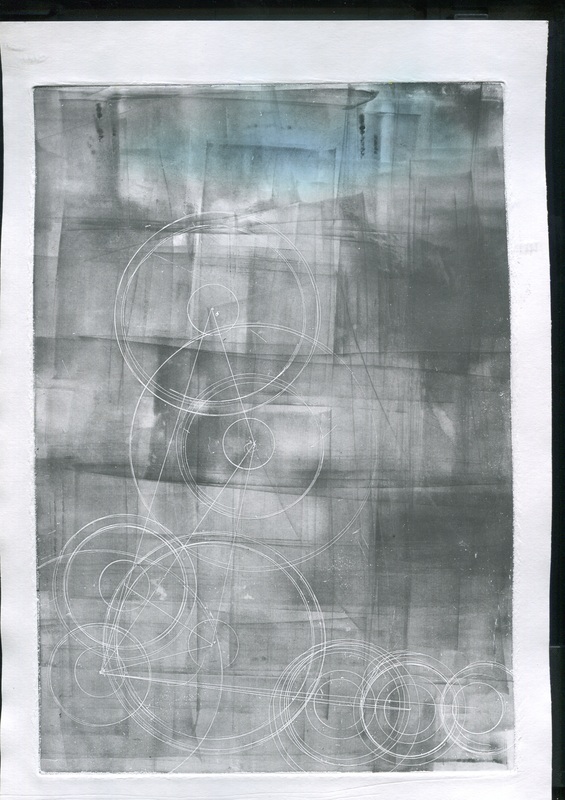
By accident on one of my first etchings I had not gotten ink into the dips of the etched lines and this created a white line against the grey of the plate that hadn't been cleaned properly. The white lines looked great in contrast to the grey and I wanted to try do the whole plate in this way. After a few trial and errors I finally managed to get it right and printed many of my plates in a 'negative' way. I've been asked to be part of an exhibition that is being organised by John Lynch, it is about the course, involving students from each year and students who have left. I am really excited to be part of this exhibition, I am going to put a future etching into the exhibition. The etching will be about measuring peoples experiences with time and how different they all are, as I would like to use the circle graphs as I think they work really well. 
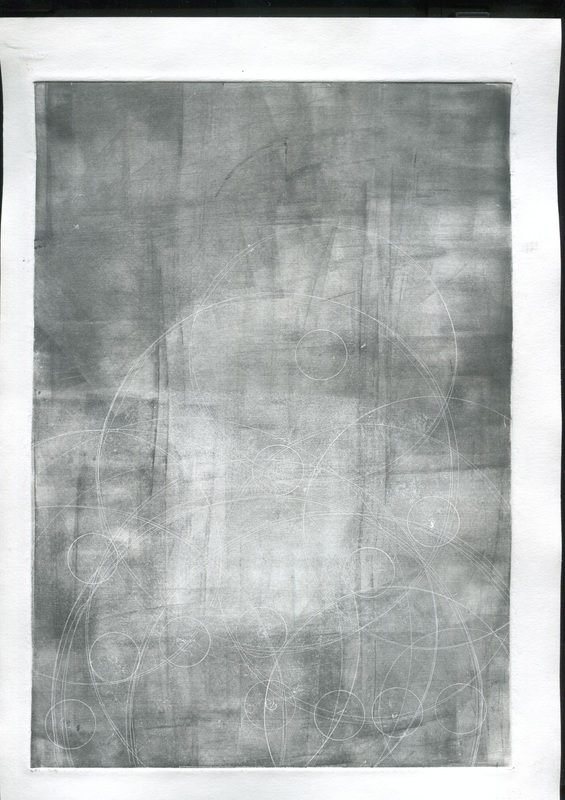
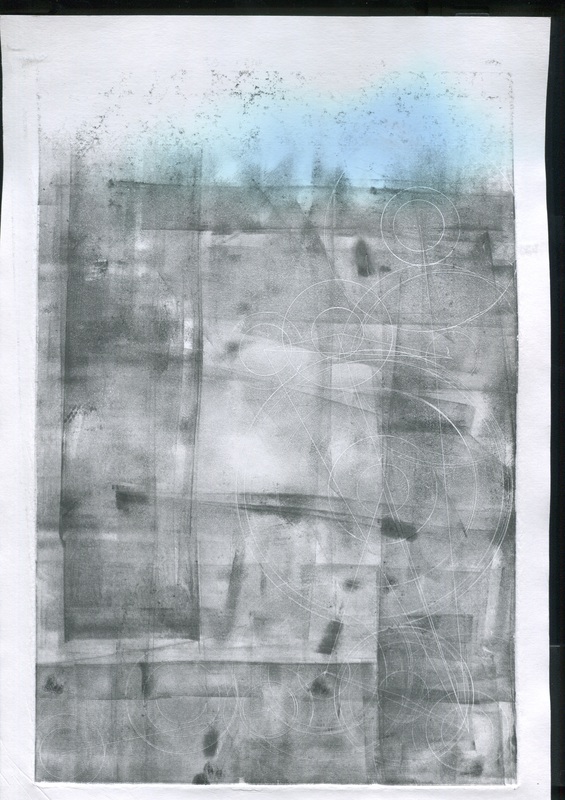
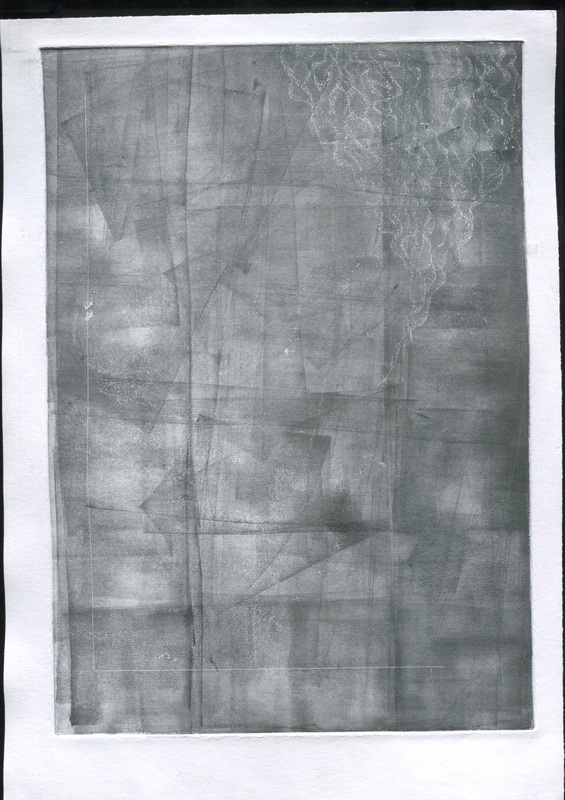
After making many graphs and charts to measure what seemed to be unmeasureable I have written myself a brief of' 'Charting The Unmeasureable'. The brief is what thoughts I have had about my tittle, the next thing that I am measuring is time. Time is thing that is measured everyday but peoples feelings and experiences of time is all very different. I will be making a graph based on the circle graphs and the cloud of confusion graph as I particualry liked certain elements from them both. I will follow these questions and try to measure things that are deemed un-measurable and immeasurable. 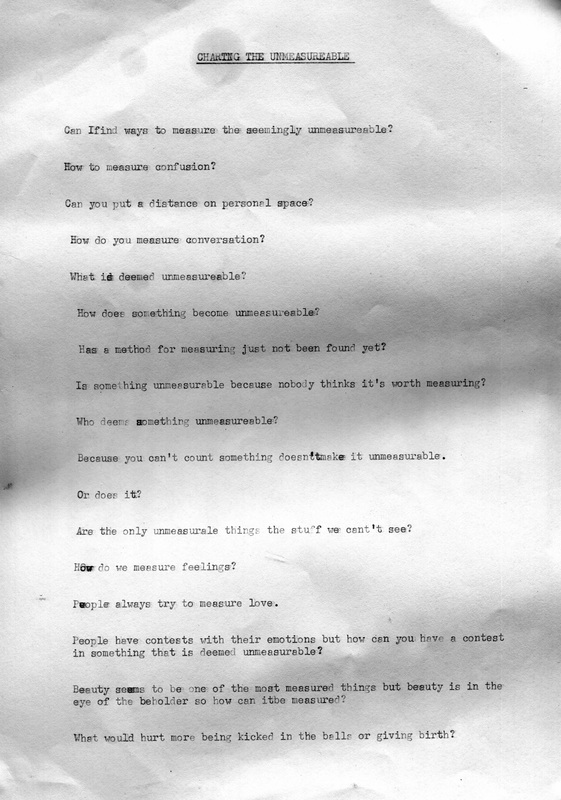 For these graphs I have asked people to fill in a little cards plotting their confusion to their to the number of ideas they have had for Unit X. I did this research to see if my graph would be similar to anyone else's and if there would be a correlation between them, the data that I have received was too wide spread to show a correlation between confusion and number of ideas. It was very interesting to see how people wrote their graphs and what they looked like. This etching is based on a graph of personal space and conversation. I particularly like the etching plate of these one. I will definitely carry on with the circle design. 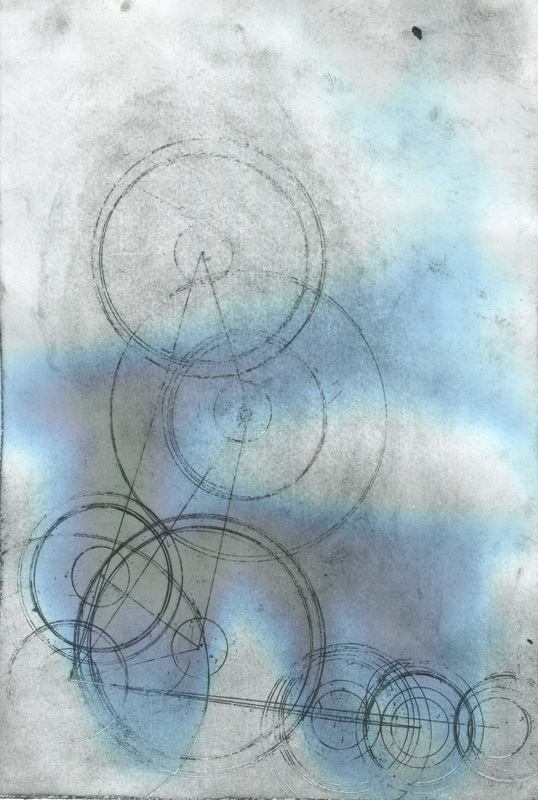
| AuthorThis page is for unit X in interactive arts. As I was starting a new project I felt like the project needed a new page. ArchivesCategoriesAll |
 RSS Feed